
The Big Picture of Educator Workforce Pipeline Research
Thinking about supply and demand. South Carolina has more than one way to measure its educator workforce—and each one tells a different story. Below are three data-driven narratives: one built on vacancy counts, one built on following people through the pipeline, and one built on district-level workforce totals. Each challenges the way we think about, and measure, the supply and demand of teachers.
Narrative 1: Counting positions
Vacancies refer to teaching and service positions that remain unfilled as the school year begins, as reported by districts in the annual Supply & Demand Survey.
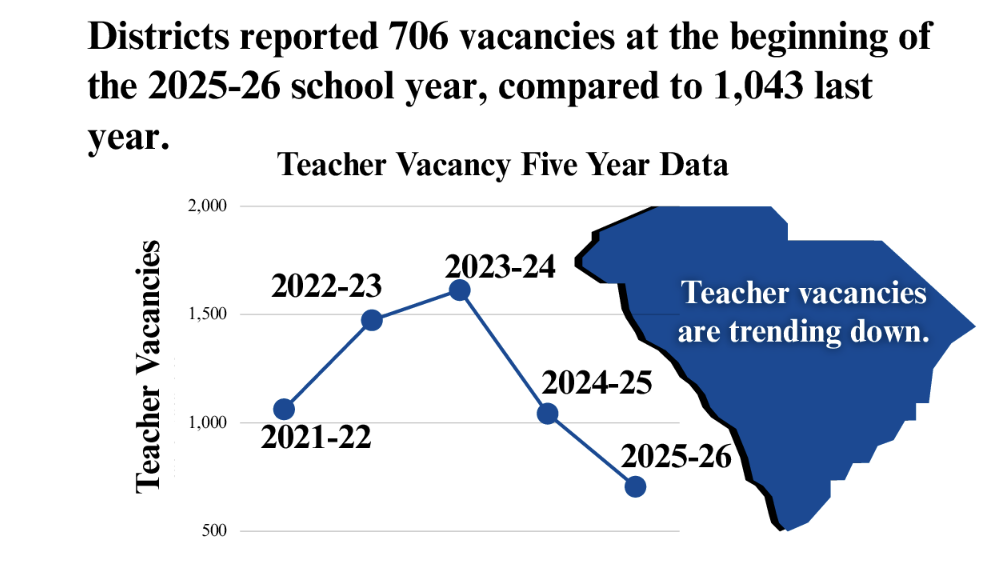
What the vacancy data show now
Vacancies refer to teaching and service positions that remain unfilled as the school year begins. Districts reported a 32% decrease in teacher vacancies compared to last year—and some of those vacancies may have been filled, and new ones may have emerged, since districts submitted their Supply & Demand Survey.
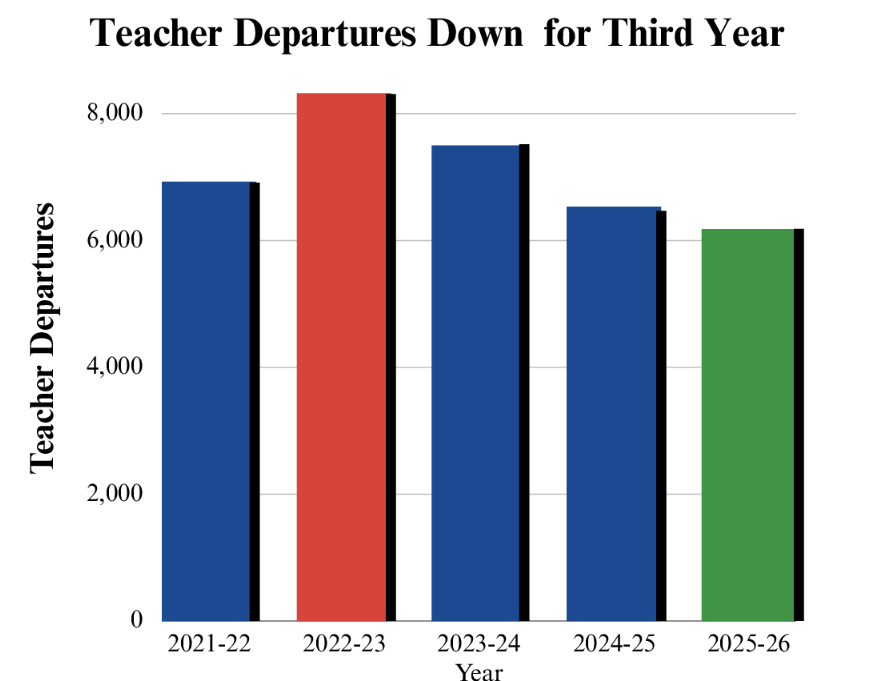
Departures refer to certified educators who did not return to a teaching or service position in the same school district the following year. Districts reported a 5% decrease in teacher departures compared to last year; of the departures, 19% retired from the profession and 25% transferred to another SC public school district.
What vacancy counts actually measure
Vacancies measure positions—not people. Vacancy counts go up when districts create more positions, budget for positions they ultimately cannot fill, expand staffing during funding surges, or hire on different timelines. They go down when funding drops and posted positions are eliminated, when districts consolidate roles, or when hiring freezes occur. None of these changes reflect teacher behavior; they reflect district budgeting behavior.
Narrative 2: Following people
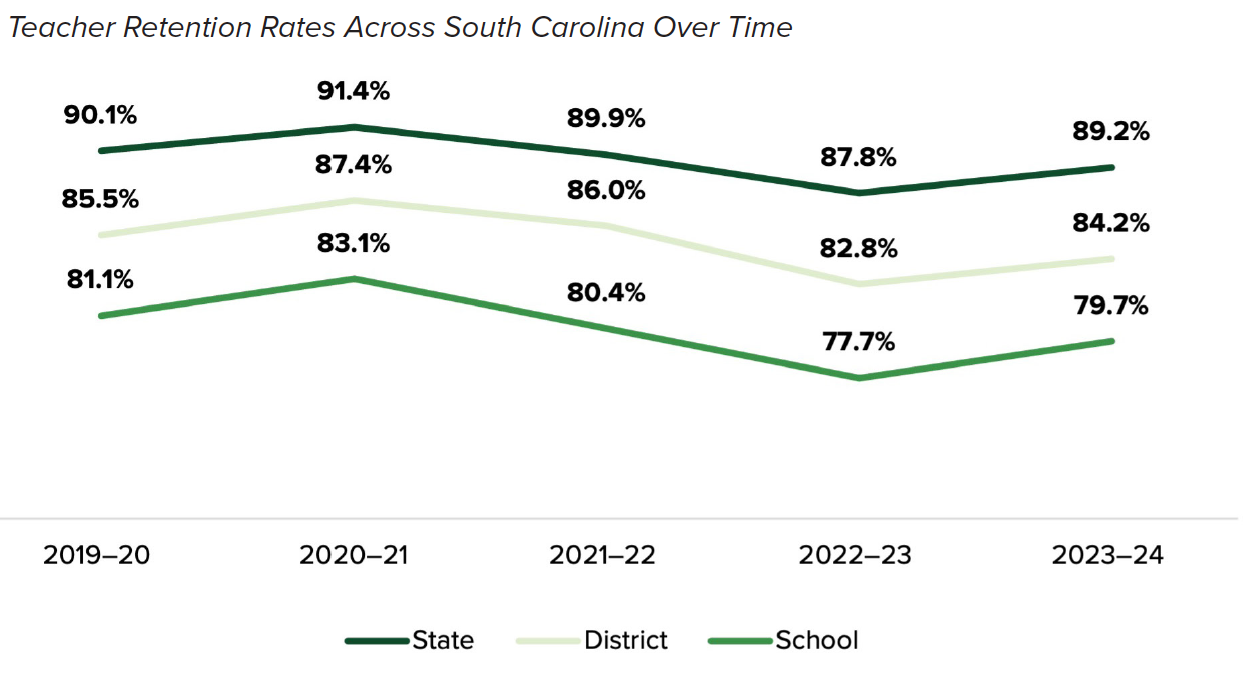
SC TEACHER’s longitudinal approach tracks every teacher statewide—real retention, real exits, real new entrants, and real movement between districts—using SCDE data.

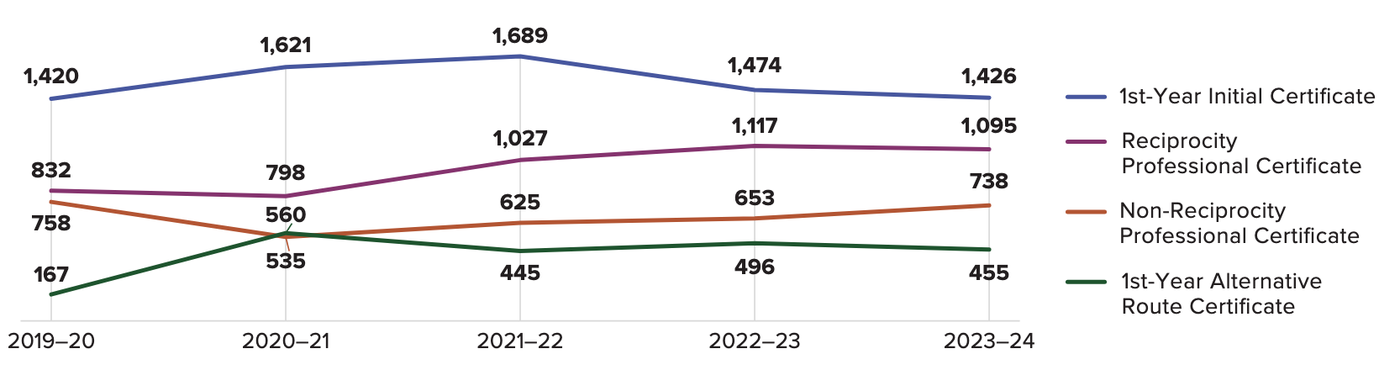
What the movement data really showed
- No evidence of statewide mass exit.
- Retention stable at the state level, not collapsing.
- Movement patterns consistent with pre-pandemic years.
- Pipeline entry shifting toward less reliance on recent graduates.
Narrative 3: District totals
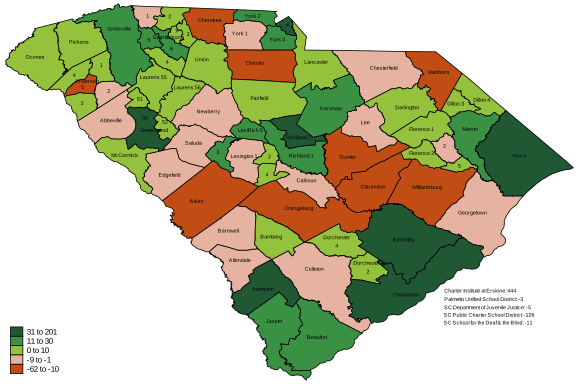
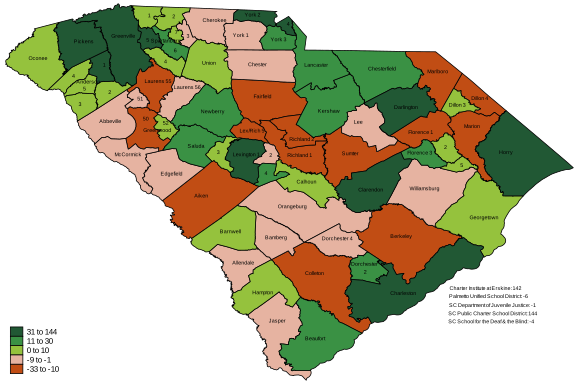
A third lens: the change in each district’s total number of teachers, year over year. Green districts grew; rust districts shrank.
What the district lens adds
Statewide numbers—whether vacancies or retention rates—can mask what is happening locally. In the same year, some districts added dozens of teachers while neighboring districts lost them. A stable state average can contain both a growing Lowcountry district and a shrinking rural one. Supply and demand for teachers is not one statewide market; it is dozens of local ones, shaped by enrollment, funding, geography, and competition between districts.
Probing questions
- Which of the three narratives have you heard most often in your district or community—and from whom?
- What decisions—budgets, programs, policies—have you seen made in response to the vacancy narrative? Would the person-centered data have changed them?
- Each narrative measures something real. What question is each one the right tool for answering—and where does it mislead?
- The district maps show growth and shrinkage side by side. What would a statewide policy have to look like to serve both kinds of districts at once?
- Who has the actual authority to change which workforce metrics get collected, reported, and cited—and what would it take to move them?
- How should this shape the messages we craft? What is a claim about the educator workforce you could now state—and defend—with specific evidence?